Exploring Visual Illusions and Fractals with p5.js
In this post, I dive into two personal coding projects I built using p5.js, a JavaScript library perfect for creating visual and interactive experiences. These projects—the Impossible Gear Cascade and the Mandelbrot Spiral Visualization—blend art, mathematics, and programming in a way that’s both fun and educational. I developed them as side explorations with help from Grok (xAI), and they’re a great fit for showcasing my creative side outside of my professional work.
You can check out the code for both projects on GitHub:
Impossible Gear Cascade
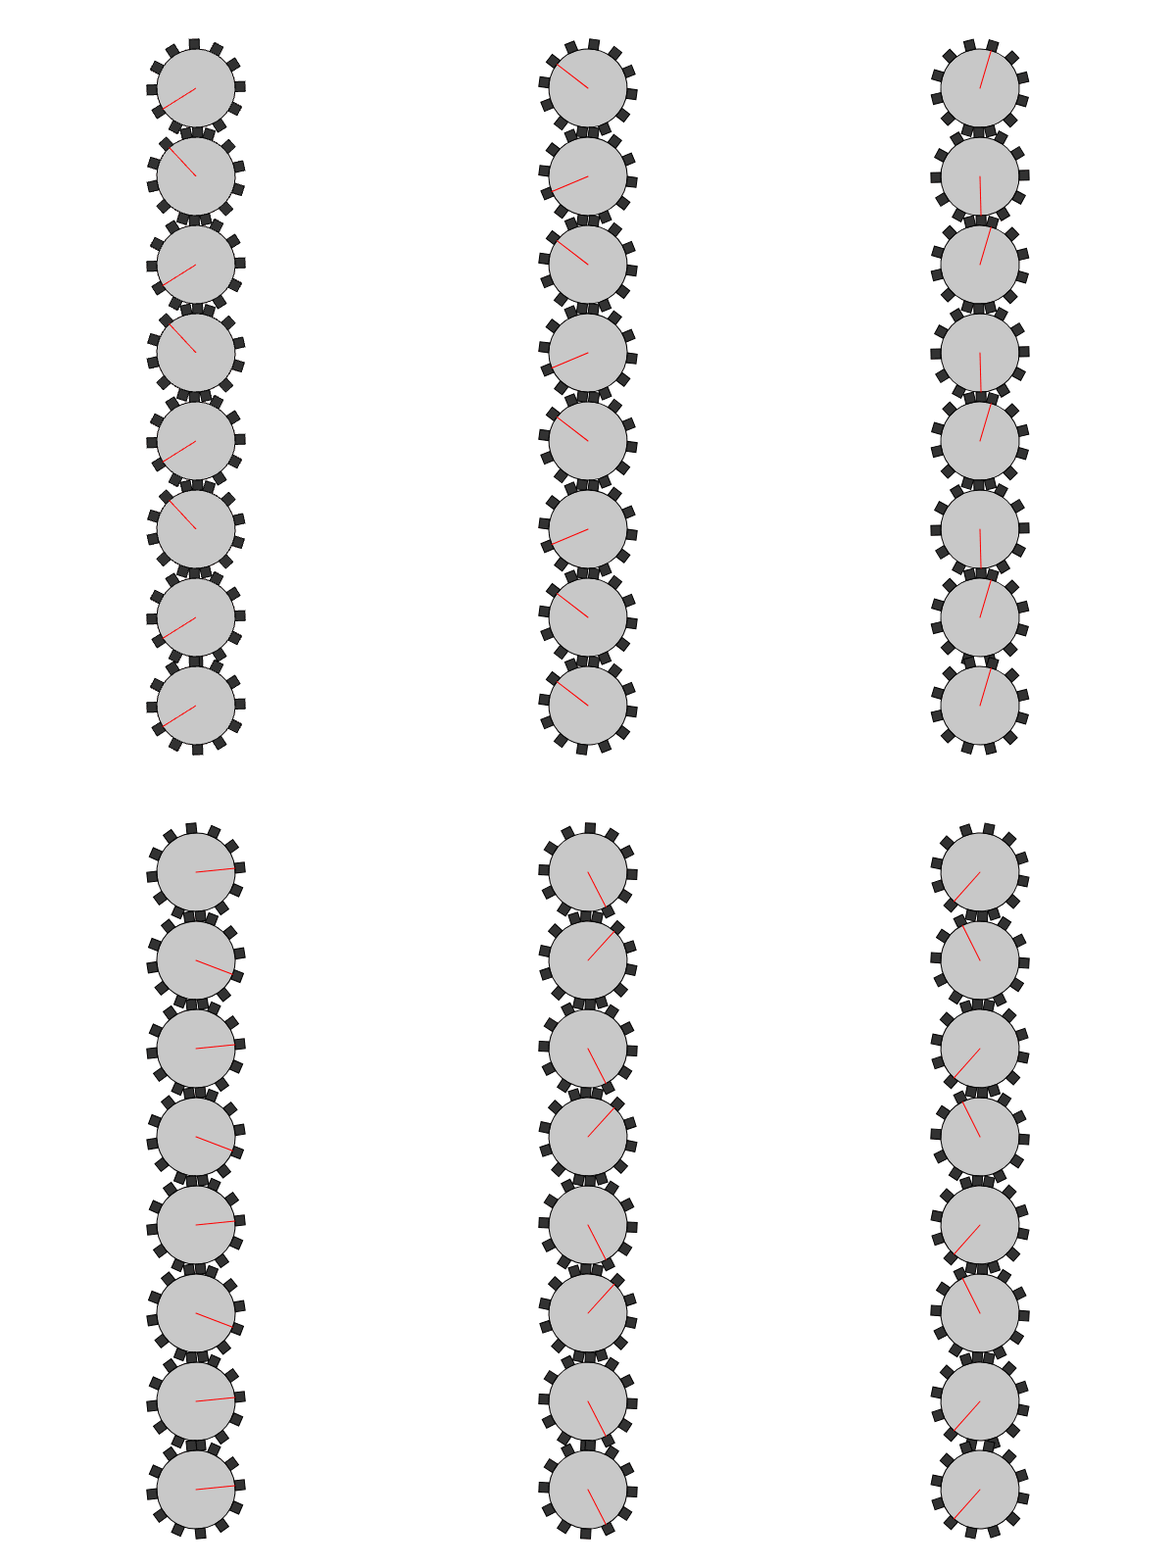
The Impossible Gear Cascade is an optical illusion that plays with your perception of how gears should work. Normally, adjacent gears rotate in opposite directions, but in this illusion, the bottom gear spins in the same direction as the top gear. The result is a mesmerizing effect that seems to defy physics.
How It Works
- Gear Design: I used p5.js to draw each gear, starting with
ellipse()for the circular body and addingrect()shapes for the teeth. - Stacking Gears: The illusion features a stack of eight gears. Each gear rotates opposite to the one above it—except the bottom gear, which matches the top gear’s direction.
- Teeth Alignment: I carefully adjusted the angles so the teeth of adjacent gears appear to mesh, even though the motion suggests otherwise.
- Interactivity: Clicking the canvas reverses the rotation direction, letting you see the illusion hold up from different perspectives.
Here’s what it looks like in action:

Working on this with Grok was a blast—it’s a perfect example of how coding can create something visually intriguing.
Mandelbrot Spiral Visualization
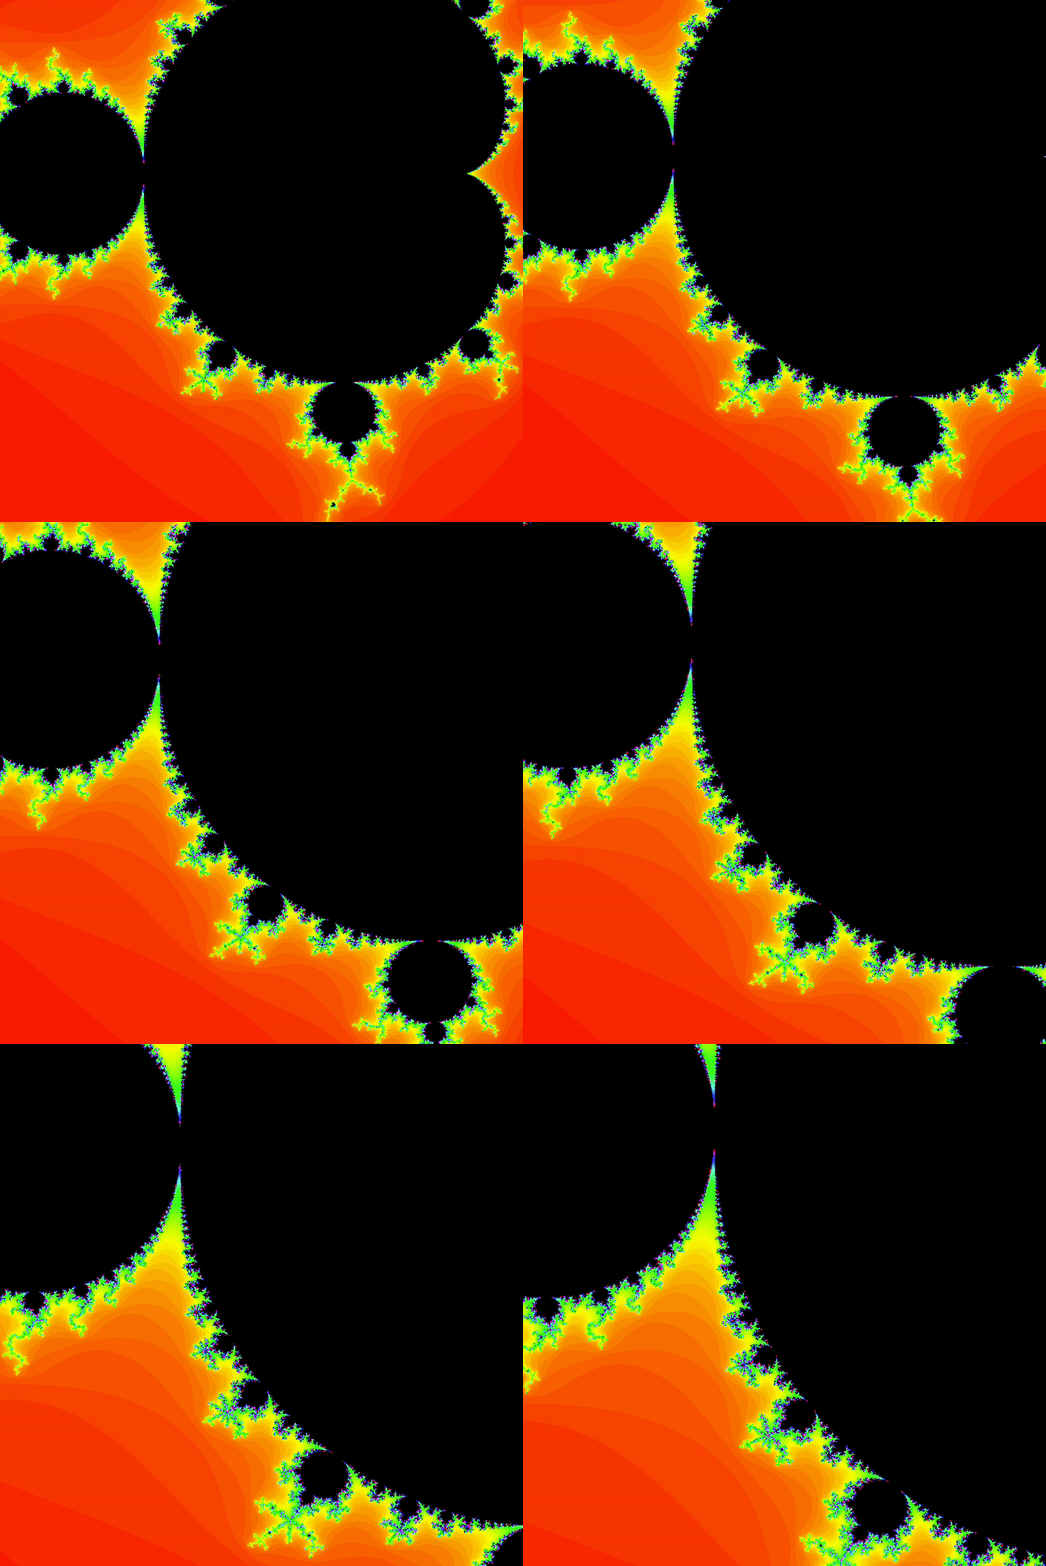
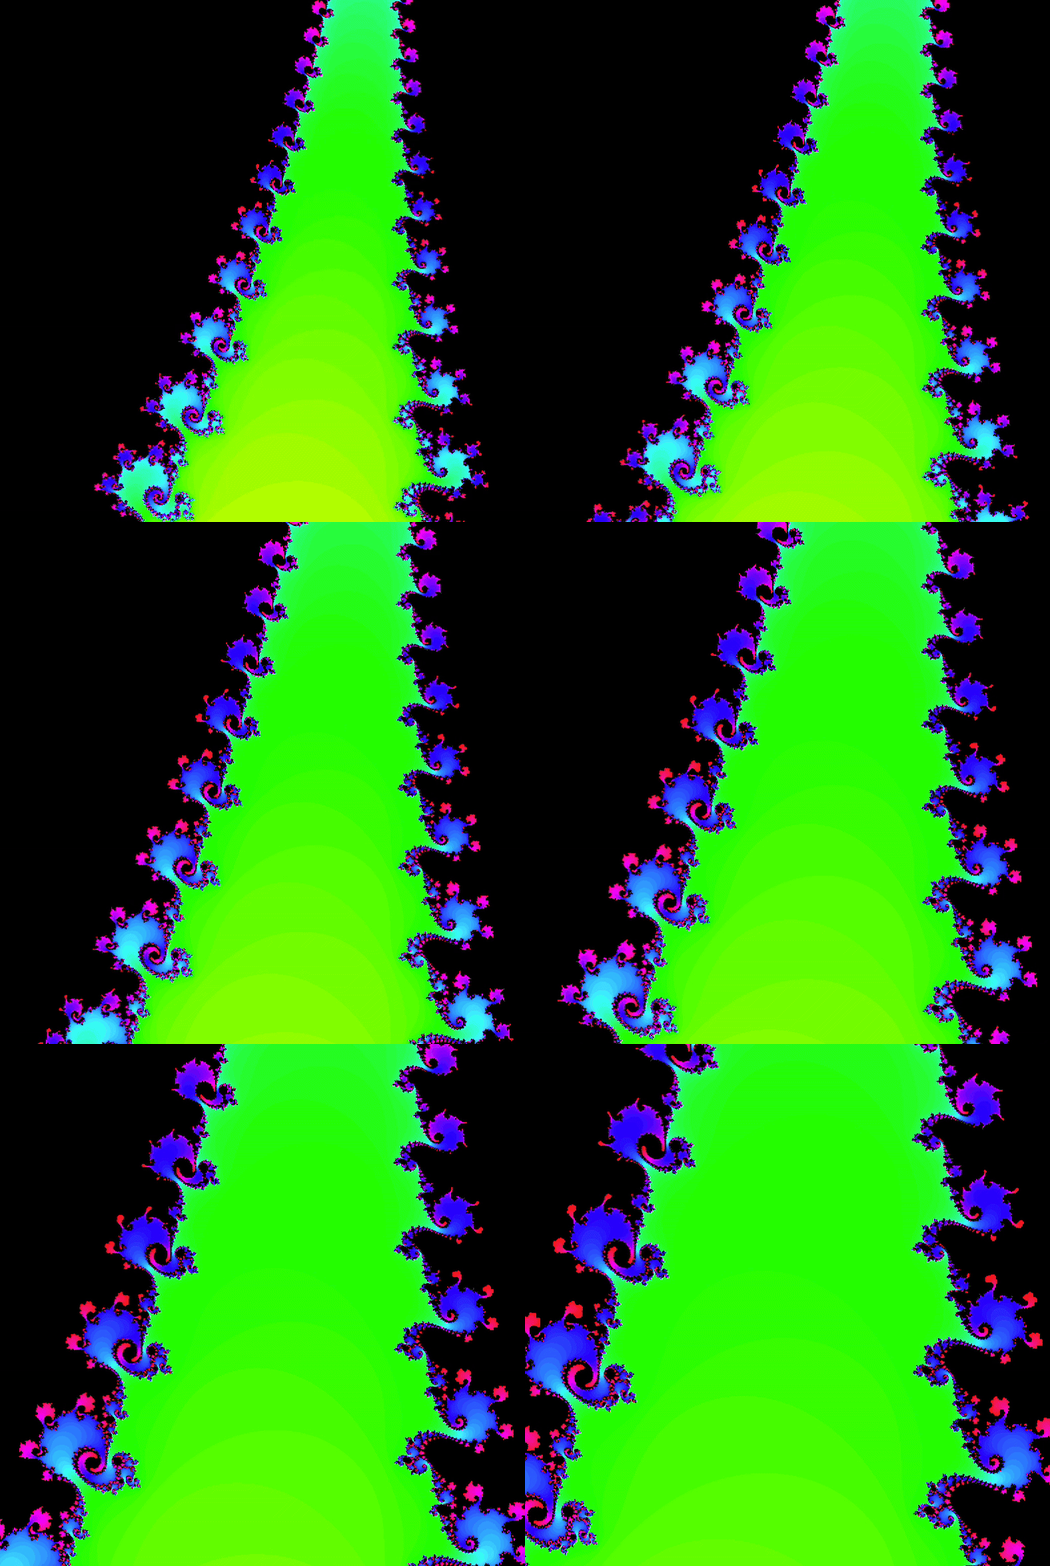
The Mrahhhndelbrot Spiral Visualization brings the Mandelbrot set—a famous fractal—to life with a spiraling zoom effect. This project animates a dive into the fractal’s boundary, revealing its stunning, self-similar patterns.
Technical Implementation
- Mandelbrot Math: For each pixel on an 800x800 canvas, I mapped a complex number ( c ) and iterated the equation ( z_{n+1} = z_n^2 + c ). The number of iterations determines the color, showing whether ( c ) is inside or outside the set.
- Spiraling Zoom: The zoom is exponential and centers on the point (-0.75, 0.1), a region known for its spirals. I used trigonometric functions to make the view spiral inward over time, creating a dynamic effect.
- Performance: While p5.js isn’t built for heavy math, it handled this visualization smoothly on typical hardware.
Check out the zoom in these two animations:


This project was a fun way to explore fractal geometry and push p5.js to visualize something mathematically beautiful.
Conclusion
The Impossible Gear Cascade and Mandelbrot Spiral Visualization are two of my favorite personal projects. They showcase how p5.js can turn abstract ideas—like optical illusions and fractals—into interactive art. I had a great time building them, and I hope they inspire you to play with code too.
If you’re curious about p5.js, their get-started page is a fantastic place to begin. Feel free to fork my GitHub repos and tweak these projects yourself!